
Fall is upon us, and that means apple season. Here in the Pacific Northwest we have some of the best apples around. But there is one apple that is not for eating in the patent world and today’s topic relates to a patent drafting tip used extensively by Apple.
An important part of any application (other than some chemical inventions) is the drawings. There are various types of drawings that are typical in a patent application, such as system diagrams, cross-sections, flow charts, block diagrams, and state diagrams. The different types of figures are useful tools in explaining and supporting an invention.
One particular type of drawing that is especially useful in networking-related applications are signaling diagrams. They may also be called network communication diagrams, flow diagrams, etc.; but they all have a similar look. The figure below is taken from an example Apple patent (US 13/355,441) and illustrates data flow and timing among various devices or applications in the context of a handover.
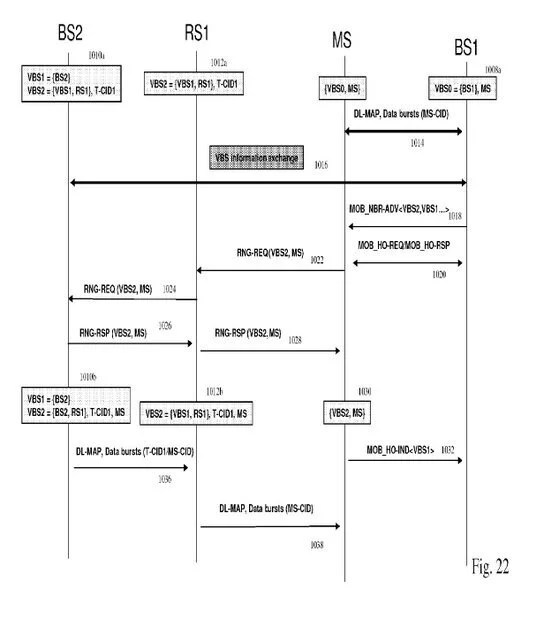
The advantage of these flow diagrams, as opposed to flow charts, is that they inherently include disclosure (via vertical positioning/ordering and horizontal positioning/ordering) of the relative timing of when messages are sent relative to each other to or from the various stations. This relatively rich disclosure can often provide details that prove necessary during prosecution for distinguishing unexpected prior art. They also show example operation in a way that may be easier for an examiner to visualize and so can aid examiner interviews where one is trying to illustrate the difference from the prior art.
So when you drafting applications in the networking arts, consider how to illustrate the invention with a signaling diagram.

Leave a comment